


Learning how to use AI for data analysis starts with a clear question, a well-structured spreadsheet, and a way to check the answer. AI can help clean data, suggest formulas, summarize patterns, and create charts, but you still need to define what the numbers mean.
This guide follows one small, hypothetical workshop dataset from raw rows to a checked conclusion. You can copy the table into a spreadsheet and repeat the calculations yourself. For a broader introduction to AI-assisted work, see Atlas Learners’ everyday AI task guide.
Start With One Answerable Question
Ask a question the available data can answer. “What insights can you find?” encourages a broad response. “Did attendance improve between September and October?” is more focused, but still needs a definition of improvement.
Do you mean more people attended, a larger share of registered people attended, or both? Those measures can move differently. We will compare attendance counts and attendance rates for sessions with complete attendance records.
Choose the tool based on where the data already lives. ChatGPT data analysis can work with uploaded structured files and run calculations. Copilot in Excel supports workbook questions, formulas, and summaries. Gemini in Google Sheets supports analysis and charts inside Sheets. Access depends on the account and feature, so check your available options before moving data or paying for a plan.
You can check every calculation in the small example below with an ordinary spreadsheet. The tool descriptions come from official documentation; they are not results from a hands-on product comparison.
Prepare and Inspect the Spreadsheet
Keep an untouched copy of your source. In the working copy, use one row per record, descriptive headers, consistent dates, and separate columns for values you may need to compare.
Here, one row should represent one workshop session. A unique session ID helps distinguish a duplicate export from two legitimate sessions with the same attendance. A repeated value alone is not a reason to delete a row.
Write down units and definitions. “Registered” means registrations for that session; “Attended” means attendees counted for that session. These are session counts, not necessarily distinct people across the whole month. Someone attending two sessions appears in both session totals.
OpenAI’s spreadsheet preparation guidance recommends clear column names and one record per row. Also inspect blank fields, unexpected text in numeric columns, and totals embedded among detail rows before asking for a trend.
How to Use AI for Data Analysis With a Small Dataset
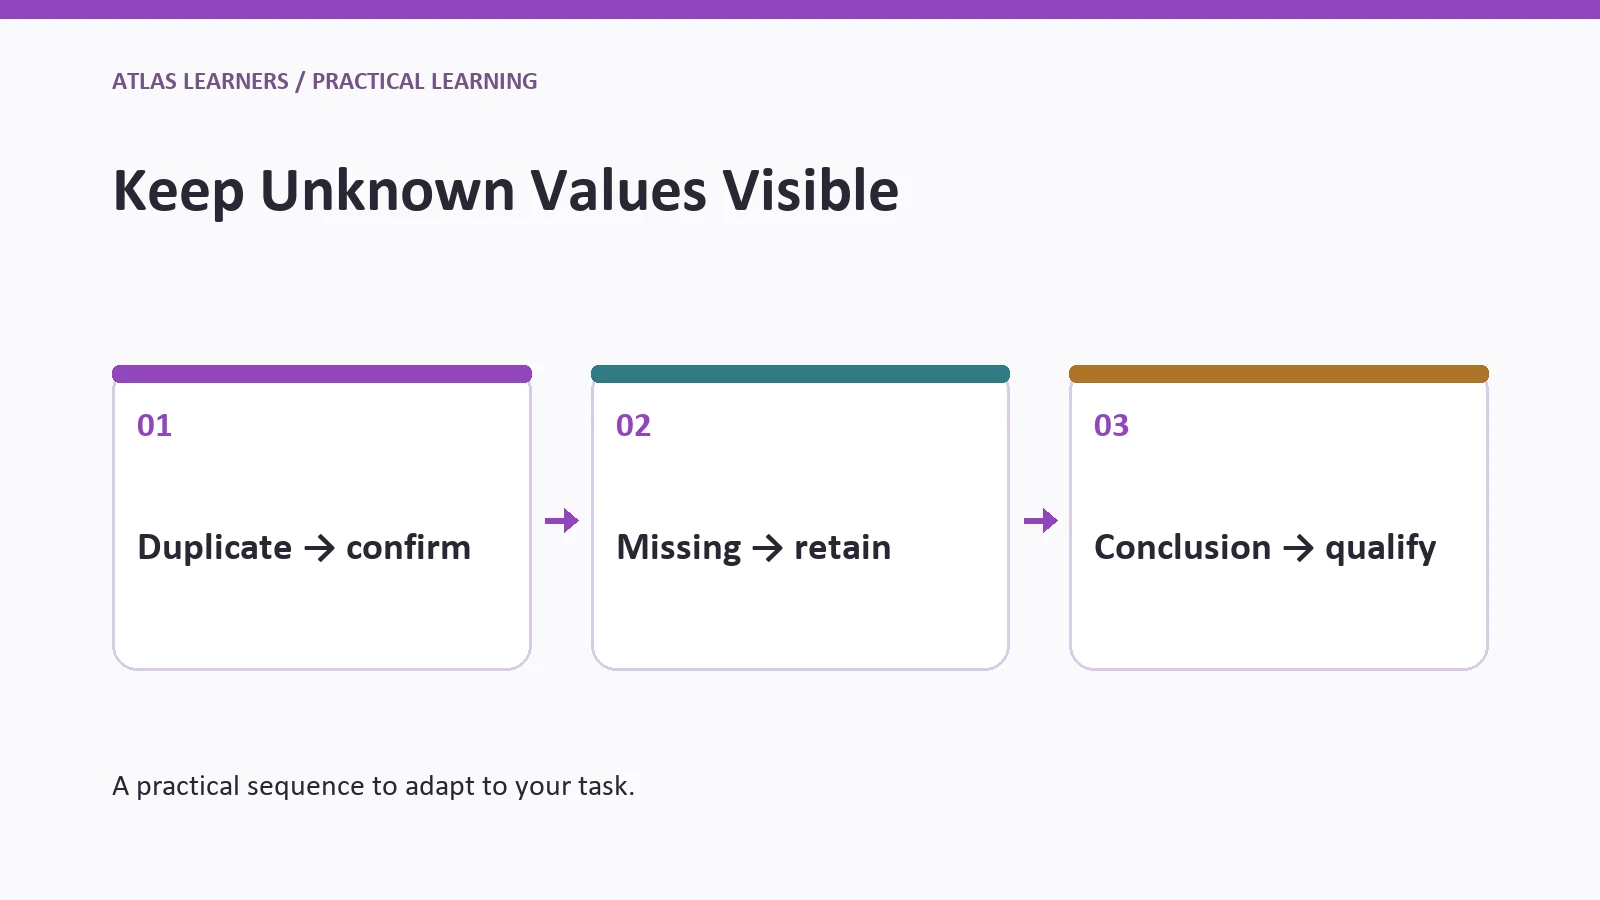
The repeated S03 row is a confirmed duplicate export. S05 has no recorded attendance count, so it needs different treatment.
|
Session ID |
Month |
Registered |
Attended |
|---|---|---|---|
|
S01 |
September |
20 |
18 |
|
S02 |
September |
30 |
22 |
|
S03 |
October |
40 |
30 |
|
S03 |
October |
40 |
30 |
|
S04 |
October |
20 |
18 |
|
S05 |
October |
10 |
Missing |
For this example, retain one S03 row after confirming it is the same session. Keep S05 in the cleaned dataset, but exclude it from the comparable attendance-rate calculation because its attendance is unknown.
This exclusion changes the meaning of the result. The comparison describes sessions with known attendance, not the complete October program. “Missing” must not silently become zero, because zero would claim that nobody attended.
Ask for the Method Before the Conclusion
Give the assistant the definitions and ask it to describe the cleaning decisions before calculating. This makes AI spreadsheet analysis easier to review.
Inspect this hypothetical workshop table. One record should represent one session. The repeated S03 is a confirmed duplicate export. Keep one S03 and retain S05 with attendance marked missing. Before calculating, list the rows included in each measure. Compare September and October using sessions with known attendance. Calculate total attendees, total registrations for those sessions, and attendance rate as total attendees divided by total registrations. Do not average session percentages. Show the arithmetic and explain the missing-data limitation.
Read the method before accepting the result. If the assistant drops S05 entirely, ask it to keep the row in the cleaned data and exclude it only from the specified calculation. If it treats the duplicate as a separate workshop, the October totals will be inflated.
These checks are a starting point for AI data analysis for beginners. With larger datasets, also check that definitions stay consistent, records match when tables are combined, and the reporting period is complete. Late-arriving records can change an earlier total.
If you want to analyze Excel data with AI, first confirm which sheet and range the assistant actually used. A successful upload does not prove every relevant row was processed. Ask it to report the row count, column names, and included dates, then compare those details with the workbook before interpreting the summary.
Check Calculations Independently
Use spreadsheet formulas or a calculator to verify the important numbers. Agreement between two AI answers is less useful than a calculation you can inspect from the original rows.
September has 18 + 22 = 40 attendees and 20 + 30 = 50 registrations. Its attendance rate is 40 ÷ 50 = 80%.
October’s complete sessions have 30 + 18 = 48 attendees and 40 + 20 = 60 registrations. Their attendance rate is 48 ÷ 60 = 80%. The 10 registrations for S05 remain outside that comparable rate because its attendee count is missing.
|
Check |
Correct Result |
What It Detects |
|---|---|---|
|
Raw rows versus unique sessions |
6 rows; 5 session IDs |
One duplicate export |
|
September rate |
40 ÷ 50 = 80% |
Wrong denominator or arithmetic |
|
October complete-session rate |
48 ÷ 60 = 80% |
Missing treated as zero or duplicate retained |
|
Known attendee-count change |
(48 − 40) ÷ 40 = 20% |
Confusion between count and rate |
After removing the duplicate, place the headers in row 1 and sessions S01–S05 in rows 2–6. With Registered in column C and Attended in D, September is =SUM(D2:D3)/SUM(C2:C3). October’s complete sessions are =SUM(D4:D5)/SUM(C4:C5). Format the results as percentages.
Do not average the two September session rates. The simple average of 90% and about 73.33% is about 81.67%, which gives the smaller session the same weight as the larger one. Summing attendees and registrations first answers the overall attendance question.
Choose a Chart That Answers the Question
A bar chart of known attendees shows the change from 40 to 48. A rate comparison shows 80% in both months. Use labels that identify the included sessions so readers do not mistake either view for complete October coverage.
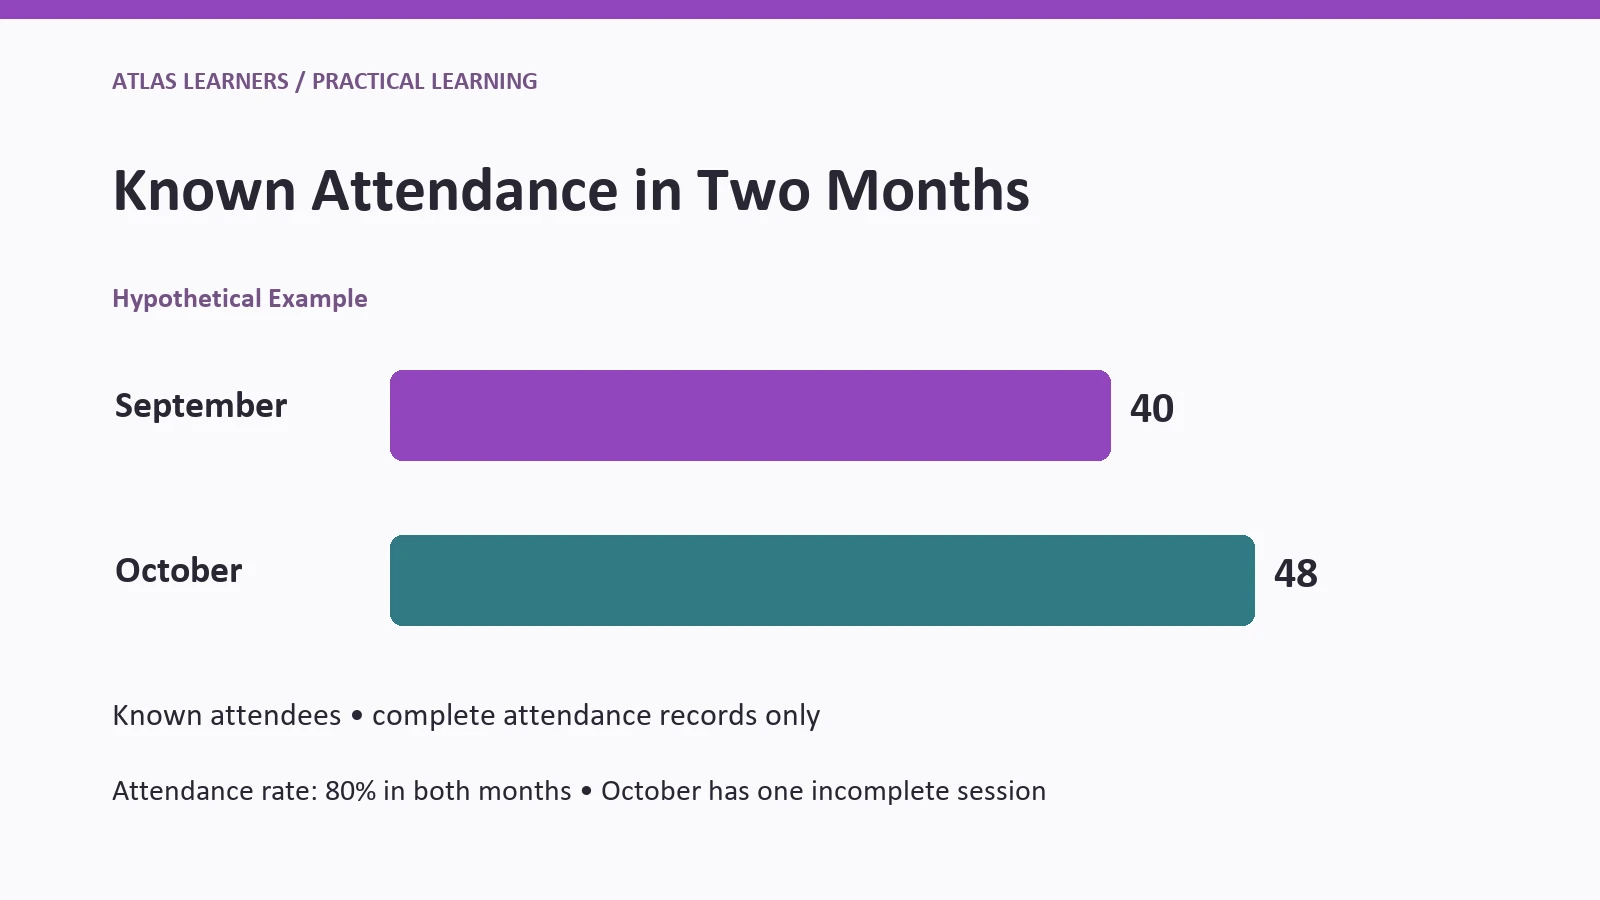
Start count bars at zero and show the values directly. Avoid a decorative three-dimensional chart or a truncated axis that exaggerates the difference. A small table can communicate equal rates more clearly than a second chart.
If you create a chart in a spreadsheet assistant, check which cells supply its data. Google’s Gemini in Sheets documentation says generated charts can use a new tab of data and may not follow changes to the original sheet. After correcting the source, check whether you need to create the chart again. Charts made from BigQuery Connected Sheets are an exception: they stay connected and update when refreshed.
Revise an Overstated Conclusion
Suppose an illustrative AI summary says, “Attendance improved by 20%, showing October’s workshops were more effective.” The attendee-count calculation is correct for the complete sessions, but the interpretation goes beyond the data.
The count increased partly alongside a larger registration total. The rate stayed at 80%, S05 remains incomplete, and attendance alone does not measure workshop effectiveness. The dataset contains no assessment of what participants learned.
A checked revision is: “Across sessions with known attendance, attendee counts rose from 40 in September to 48 in October, while the attendance rate stayed at 80%. One October session is missing attendance, so the full-month comparison remains incomplete.”
Use this follow-up prompt:
Revise the summary using only the checked results. Separate count change from rate change. State that October coverage is incomplete. Remove claims about causes or learning effectiveness because the table does not measure them. Suggest the next missing record to obtain.
This is the main habit to develop when learning how to use AI for data analysis: check both the arithmetic and the meaning attached to it.
Protect Data Before Uploading
Use the fictional table for practice. Before uploading work data, check that your organization allows both the tool and the information you plan to share. Remove personal details that the analysis does not need.
OpenAI’s data controls documentation distinguishes model-training settings from saved-chat and other controls. Turning off one setting is not blanket permission to upload confidential data. Removing names also may not be enough when other fields can identify a person.
Before someone makes a decision using the report, have a person who understands the data check the calculation and conclusion.
If you are still learning the limits of generated answers, Atlas Learners’ generative AI guide provides the background. The prompting guide can help you state definitions and exclusions clearly.
Finish With a Checked Decision Brief
Before sharing the analysis, write five lines: the question, included records, checked result, important limitation, and next action. For this example, the next action is to obtain S05’s attendance and recalculate the complete October comparison.
To practice how to use AI for data analysis, repeat the process with another small dataset you understand. Write the question and exclusions first, check the key calculation independently, and share only a conclusion you can trace back to the rows.